


Farmers read the sky. They track patterns. They anticipate change.
A DIY weather station teaches the same skills.
This project transforms basic materials into a functional forecasting tool. No expensive kits required. No complex programming necessary.
Just observation, construction, and science.
Recommended ages: 8–14 (with supervision for younger builders)
What Does a Weather Station Actually Measure?
Five core metrics define weather tracking:
- Temperature : Heat levels in the air
- Humidity : Moisture content in the atmosphere
- Air pressure : Weight of the atmosphere above
- Wind speed and direction : Movement patterns in the air
- Rainfall : Precipitation volume over time
Professional meteorologists use these same measurements. The difference lies in precision, not principle.
A homemade station captures each metric using simple physics.
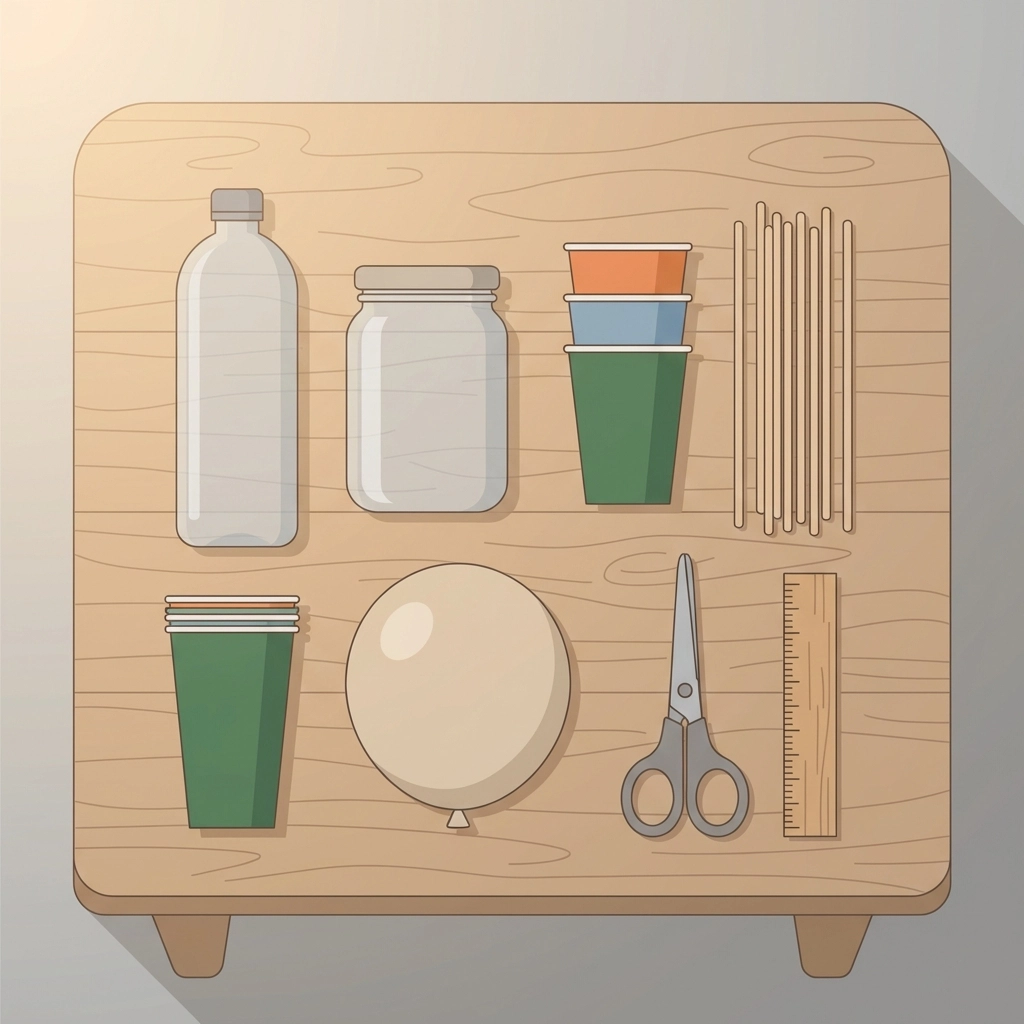
What Materials Are Needed?
Most supplies exist in typical households. Others come from hardware stores or craft shops.
For the thermometer:
- Clear plastic bottle
- Water
- Rubbing alcohol
- Food coloring
- Clear straw
- Modeling clay
For the barometer:
- Glass jar
- Balloon
- Rubber band
- Wooden skewer
- Index card
For the rain gauge:
- Plastic bottle (2-liter works best)
- Ruler
- Permanent marker
- Scissors
- Gravel or small stones
For the anemometer:
- Five small paper cups
- Two wooden dowels or straws
- Push pin
- Pencil with eraser
- Stapler
For the wind vane:
- Cardboard
- Plastic straw
- Straight pin
- Pencil with eraser
- Small paper plate
How Is the Thermometer Built?
The thermometer uses liquid expansion.
Liquids expand when heated. They contract when cooled.
Steps:
- Mix equal parts water and rubbing alcohol in the bottle
- Add a few drops of food coloring
- Insert the straw into the bottle (do not let it touch the bottom)
- Seal the opening around the straw with modeling clay
- Mark the liquid level on the straw
Place the bottle in warm sunlight. The liquid rises.
Move it to shade or indoors. The liquid falls.
Calibration happens by comparing readings to an actual thermometer. Mark known temperatures on the straw with a permanent marker.
The result: a functional temperature indicator.
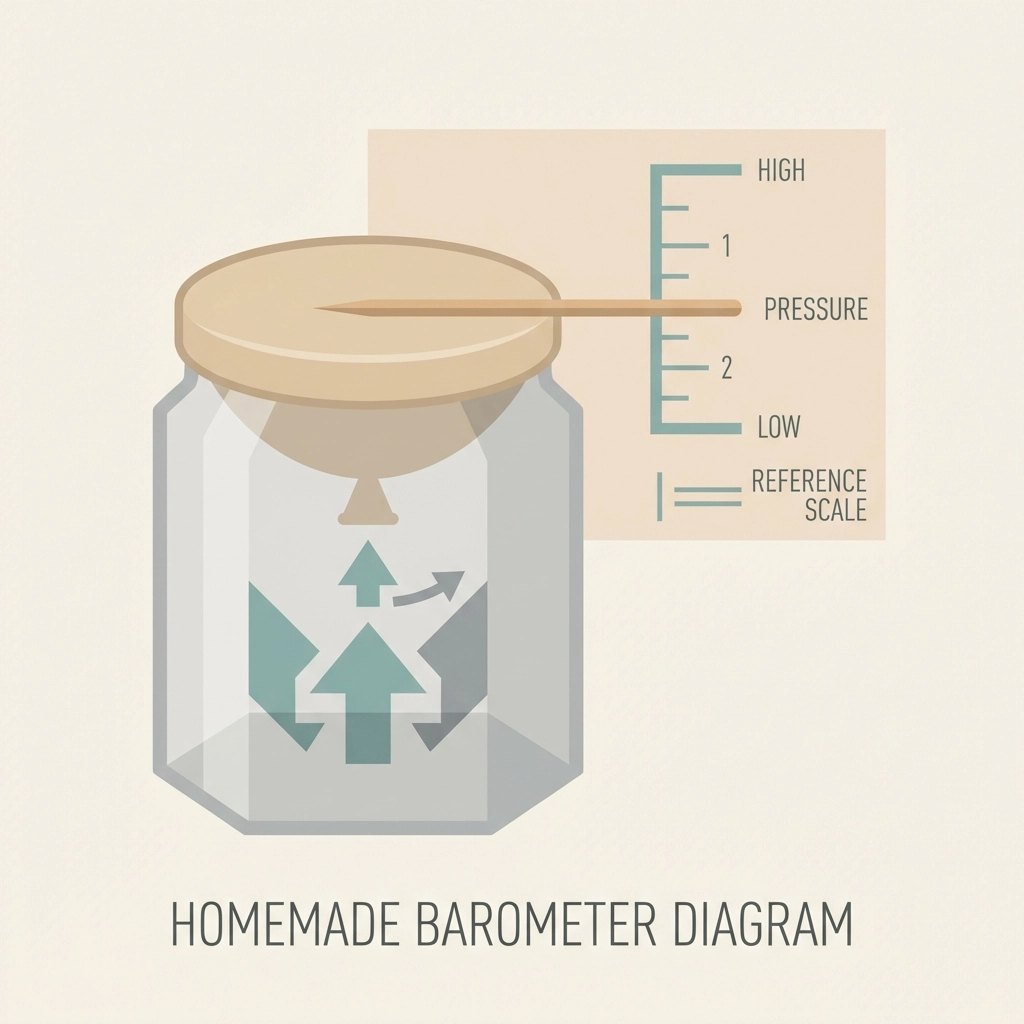
How Does the Barometer Work?
Air pressure changes predict weather shifts.
Rising pressure signals fair conditions. Falling pressure indicates approaching storms.
Steps:
- Cut the neck off a balloon
- Stretch the balloon tightly over the jar opening
- Secure with a rubber band
- Tape the wooden skewer horizontally across the balloon surface
- Position an index card behind the skewer tip
The balloon membrane responds to pressure changes.
High pressure pushes down on the balloon. The skewer tip rises.
Low pressure allows the balloon to dome upward. The skewer tip drops.
Mark the card daily. Patterns emerge within a week.
What Makes the Rain Gauge Accurate?
Rainfall measurement requires a consistent collection surface.
Steps:
- Cut the top third off the plastic bottle
- Invert the cut section into the bottom (creates a funnel)
- Add gravel to the base for stability
- Tape a ruler to the outside, starting at the gravel line
- Place outdoors in an open area
Position matters.
Keep the gauge away from trees, buildings, and overhangs. These create false readings.
Check the gauge at the same time daily. Record the water level. Empty after each reading.
One inch of collected water equals one inch of rainfall. The funnel shape concentrates precipitation for easier measurement.
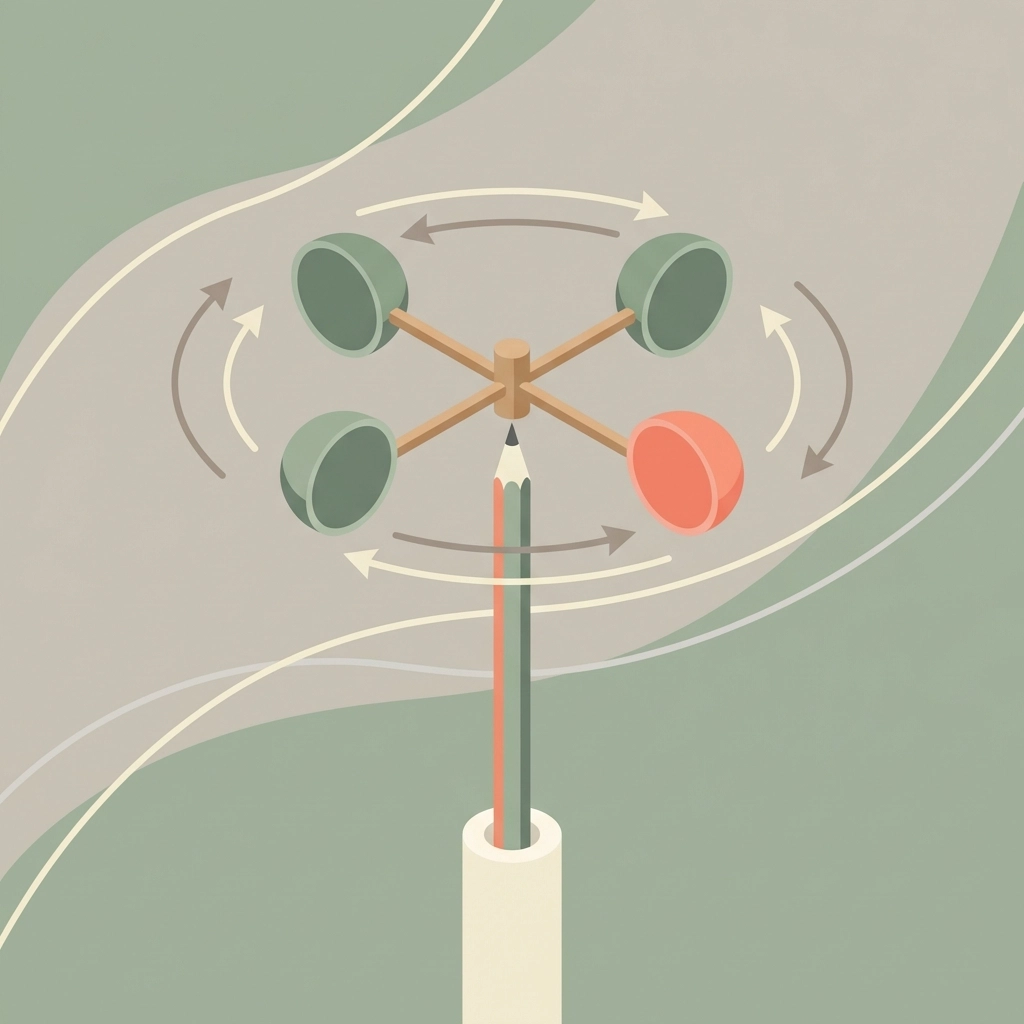
How Is Wind Speed Measured?
The anemometer counts rotations.
Faster wind creates faster spinning.
Steps:
- Color one cup a different shade (this becomes the counter)
- Staple four cups horizontally to the ends of both dowels
- Cross the dowels at their centers
- Pin through the center intersection into the pencil eraser
- Ensure free rotation
Hold the anemometer in wind or mount it on a post.
Count rotations of the colored cup in 30 seconds. Multiply by two for rotations per minute.
Higher counts indicate stronger wind.
Calibration against local weather reports refines accuracy over time.
How Does a Wind Vane Show Direction?
The vane points into the wind.
An arrow shape creates unequal surface area. Wind pushes the larger tail, rotating the arrow to face its source.
Steps:
- Cut an arrow point and tail from cardboard
- Slit both ends of the straw
- Insert the arrow point into one end, the tail into the other
- Balance the straw on a fingertip to find the center point
- Push a pin through the center into the pencil eraser
- Label the paper plate with N, S, E, W
- Mount the pencil through the plate center
Place outdoors. Use a compass to align the directional markers.
The arrow points toward the wind source. Wind from the north makes the arrow point north.
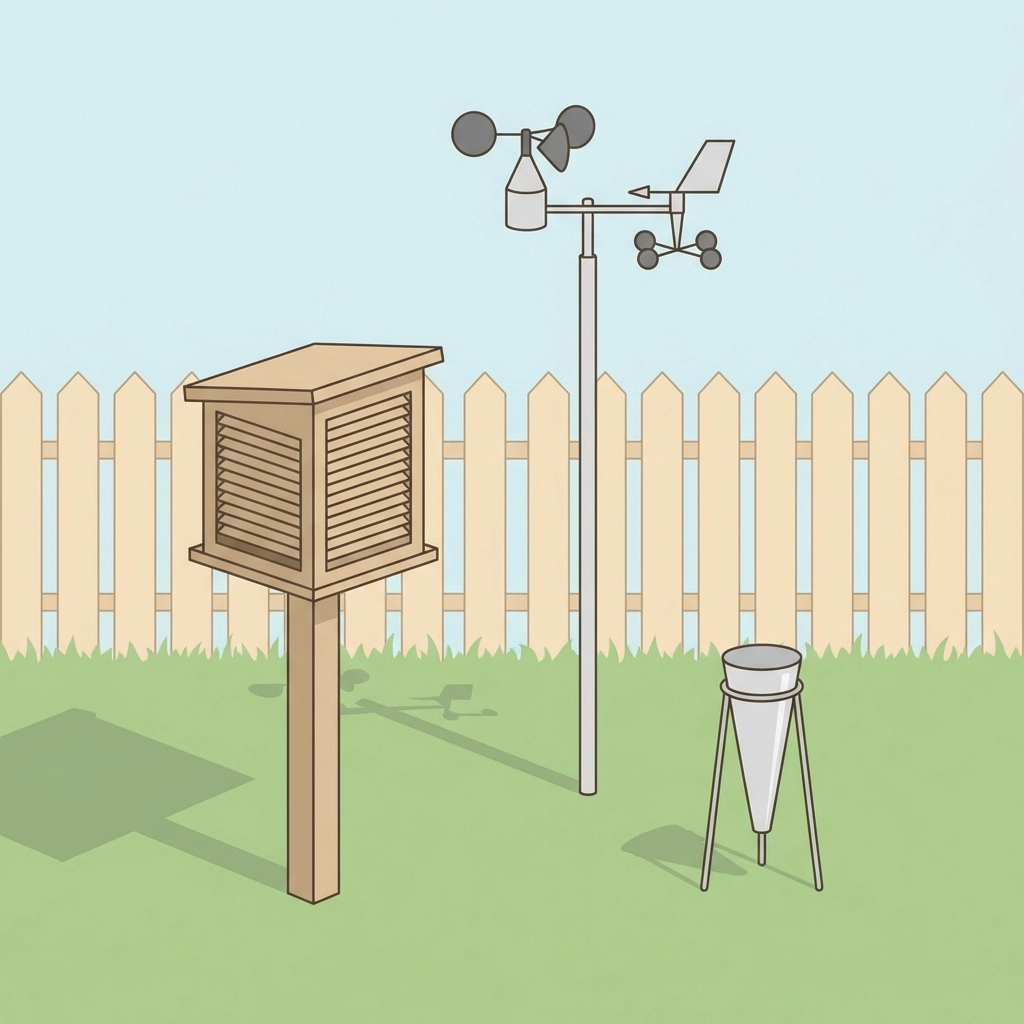
Where Should the Station Be Located?
Placement determines data quality.
Temperature and humidity sensors need shade. Direct sunlight creates false high readings. A ventilated enclosure works best: open sides allow airflow while blocking radiation.
The anemometer and wind vane require elevation. Mount on a pole or fence post. Height reduces ground-level turbulence interference.
The rain gauge stays low. Approximately one foot off the ground. Open sky above, no nearby obstructions.
The barometer remains indoors. Pressure readings work from any location. Temperature stability improves accuracy.
How Are Observations Recorded?
Data without records has no value.
Create a simple log with columns:
- Date
- Time
- Temperature reading
- Barometer position (rising/falling/steady)
- Rainfall amount
- Wind speed (rotations per minute)
- Wind direction
Daily recordings reveal patterns. Weekly summaries show trends.
Compare personal observations to official forecasts. Note discrepancies. Investigate causes.
This process builds understanding of local microclimates. Conditions in one yard differ from conditions a mile away.
What Patterns Emerge Over Time?
Weather follows sequences.
Falling barometer pressure often precedes rain within 24–48 hours.
Wind direction shifts indicate frontal passage. Southwest winds bring warmth. Northwest winds bring cooling.
Morning dew combined with steady pressure suggests fair weather ahead.
Rapid temperature drops after sunset indicate clear skies and potential frost.
Farmers learned these patterns through generations of observation. The same learning happens through consistent station monitoring.
How Can the Station Be Upgraded?
Basic stations grow into advanced systems.
Digital sensors replace handmade instruments. DHT11 or DHT22 sensors measure temperature and humidity with precision. BMP180 sensors track barometric pressure.
Microcontrollers automate data collection. Arduino boards connect sensors and log readings. ESP32 platforms add WiFi capability for remote monitoring.
3D printing creates custom enclosures and mounting brackets.
The progression from manual to digital mirrors the evolution of meteorology itself.
Start simple. Add complexity as understanding deepens.
What Skills Does This Project Build?
Construction develops fine motor coordination.
Daily observation builds consistency and attention to detail.
Pattern recognition emerges from accumulated data.
Scientific thinking grows through hypothesis and verification.
The weather station teaches more than meteorology. It teaches systematic inquiry.
Farmers understand this. Their livelihoods depend on reading natural signals accurately.
A backyard weather station offers the same education. Smaller scale. Same principles.


